> ## Documentation Index
> Fetch the complete documentation index at: https://tact.akleao.com/llms.txt
> Use this file to discover all available pages before exploring further.

# Features

> Comprehensive features of TACT for turbulence intensity adjustment

TACT provides a complete toolkit for processing, adjusting, and validating LiDAR turbulence intensity measurements.

## Adjustment Methods

TACT includes multiple adjustment methods with an extensible framework for adding more:

<CardGroup cols={2}>
  <Card title="SS-SF" icon="chart-line" href="api/adjustments/sssf">
    **Site-Specific Simple + Filter**

    Direct TI regression with filtering. Avoids error propagation through WS/SD calculations.
  </Card>

  <Card title="SSWSStd" icon="chart-mixed" href="api/adjustments/sswsstd">
    **Wind Speed + Std Deviation**

    Dual adjustment approach for both wind speed and standard deviation components.
  </Card>

  <Card title="SSWS" icon="wind" href="api/adjustments/ssws">
    **Wind Speed Adjustment**

    Adjusts wind speed measurements only. Simpler single-parameter approach.
  </Card>

  <Card title="Baseline" icon="gauge" href="api/adjustments/baseline">
    **No Adjustment**

    Reference comparison without correction. Useful for benchmarking performance.
  </Card>
</CardGroup>

<Note>
  Performance varies by dataset characteristics. Use `compare_all_methods.py` to evaluate all methods on your specific data and determine which performs best for your site conditions.
</Note>

## DNV RP-0661 Validation

Built-in industry-standard validation ensures your adjustments meet regulatory requirements.

```python theme={null}
from tact.validation import validate_dnv_rp0661

validation = validate_dnv_rp0661(
    adjusted_data=results["adjusted_data"],
    reference_col="ref_ti",
    adjusted_col="adjTI_RSD_TI",
    wind_speed_col="ref_ws",
    bin_col="bins",
    criteria_type="LV"
)

print(validation['overall'])  # Overall metrics
print(validation['by_bin'])   # Per-bin details
```

<CardGroup cols={2}>
  <Card title="Validation Metrics" icon="chart-bar">
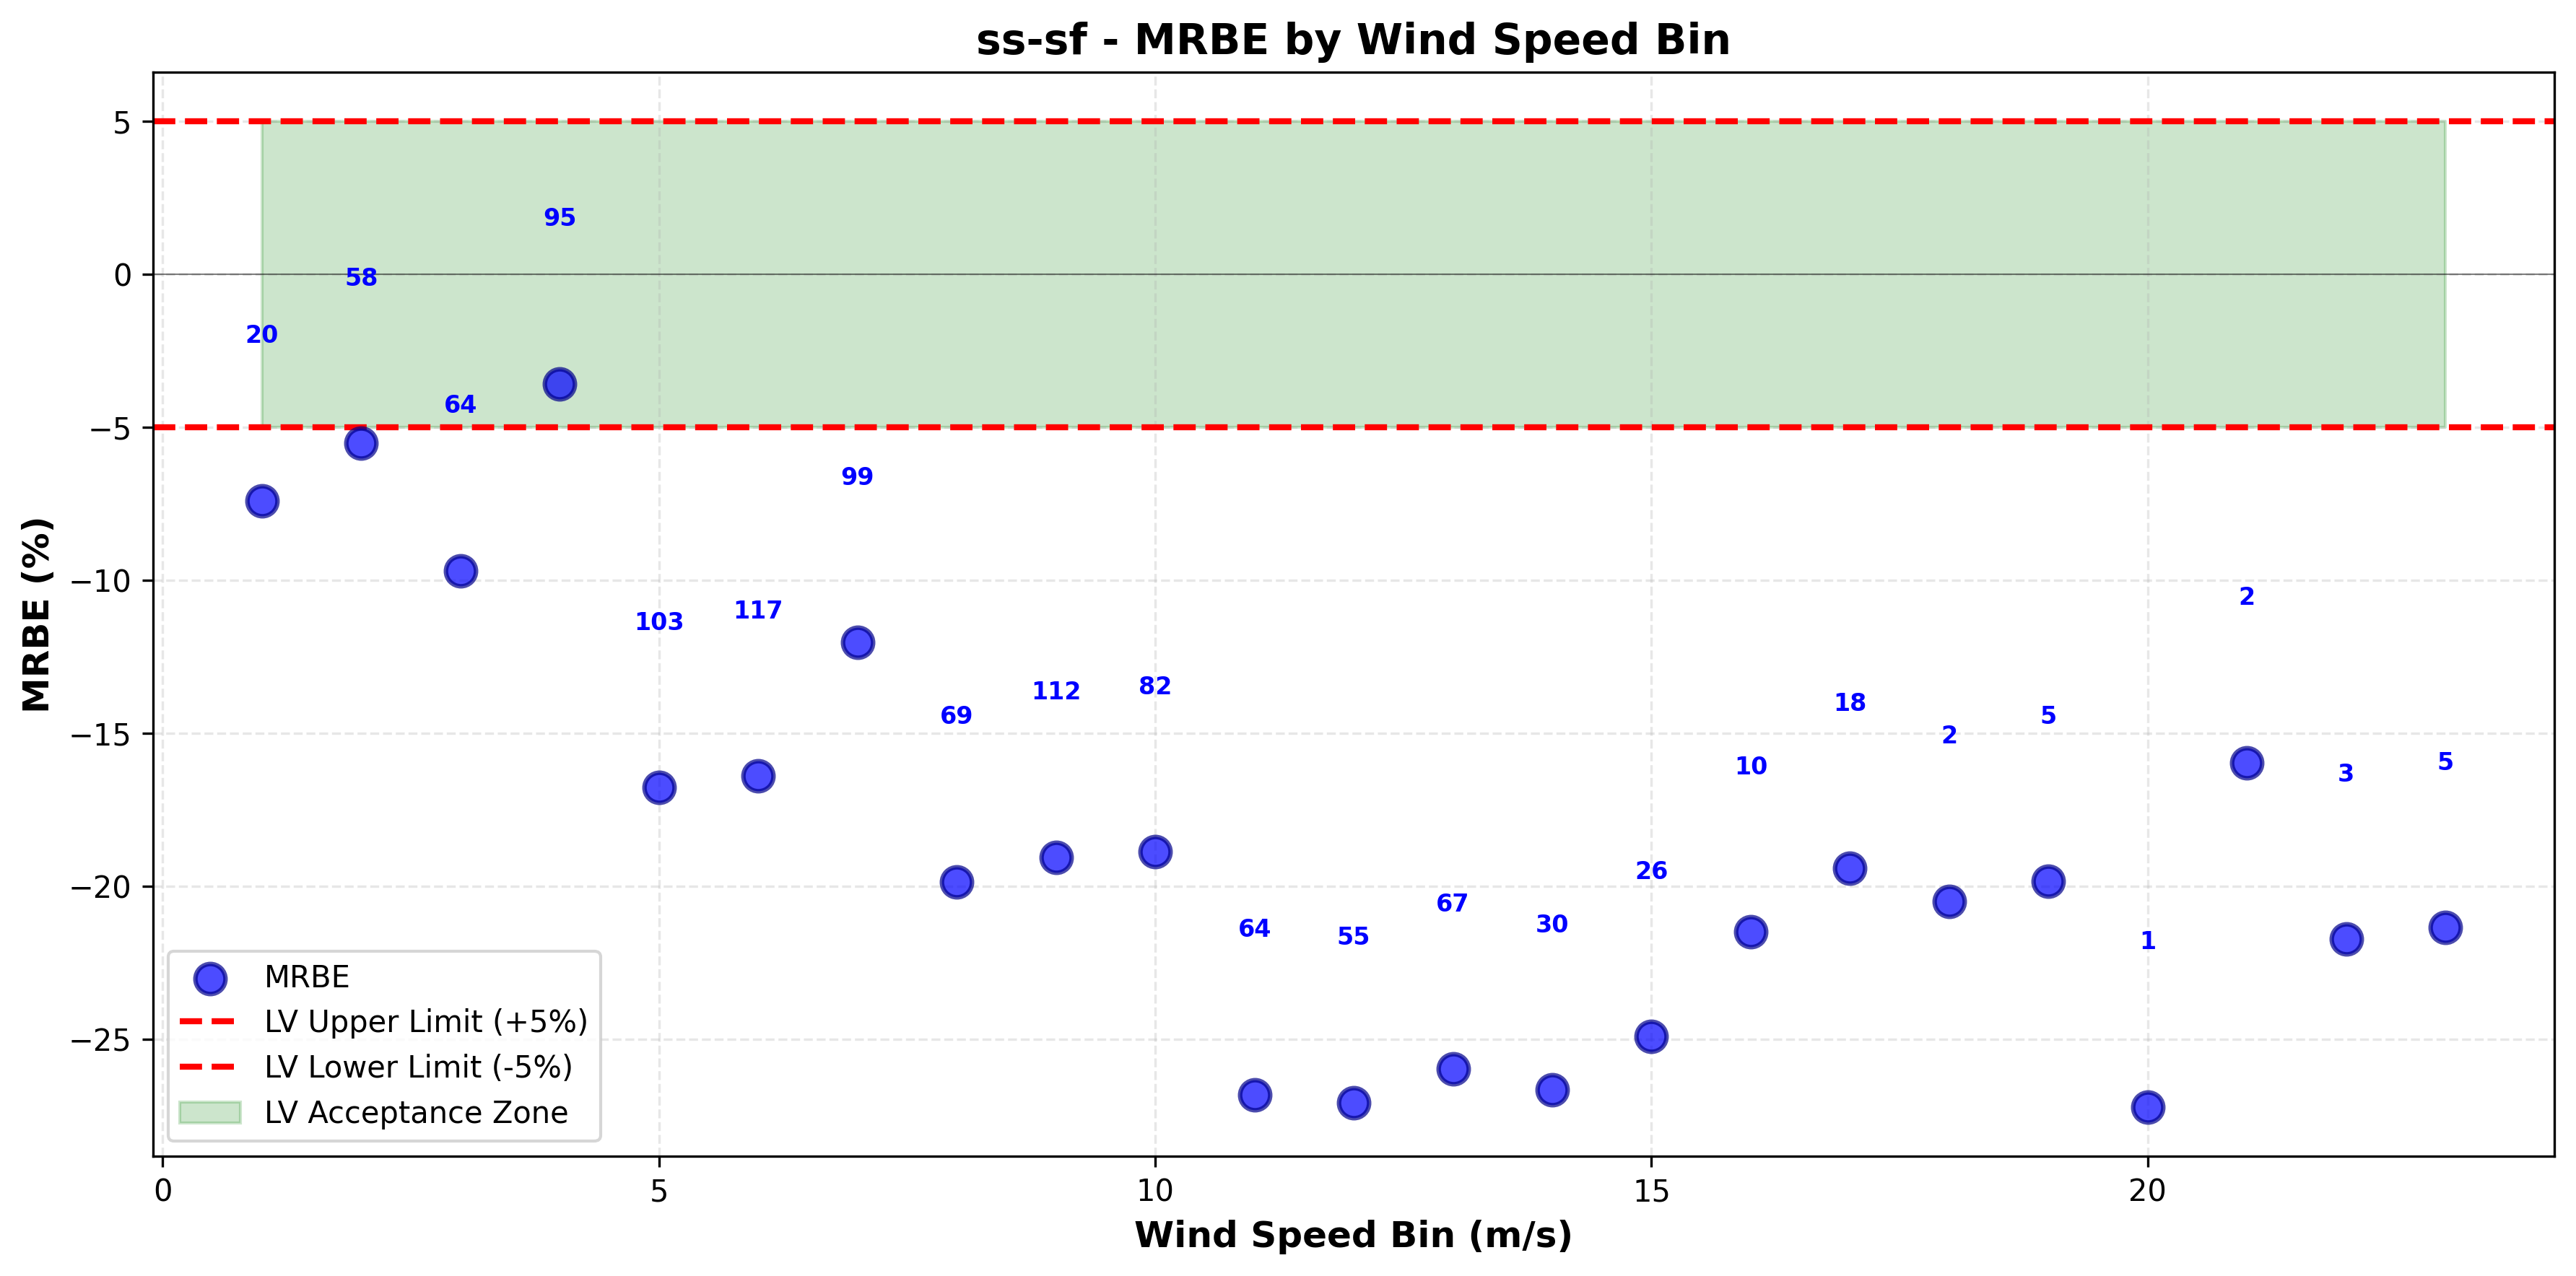
    **MRBE** - Mean Relative Bias Error measures systematic bias

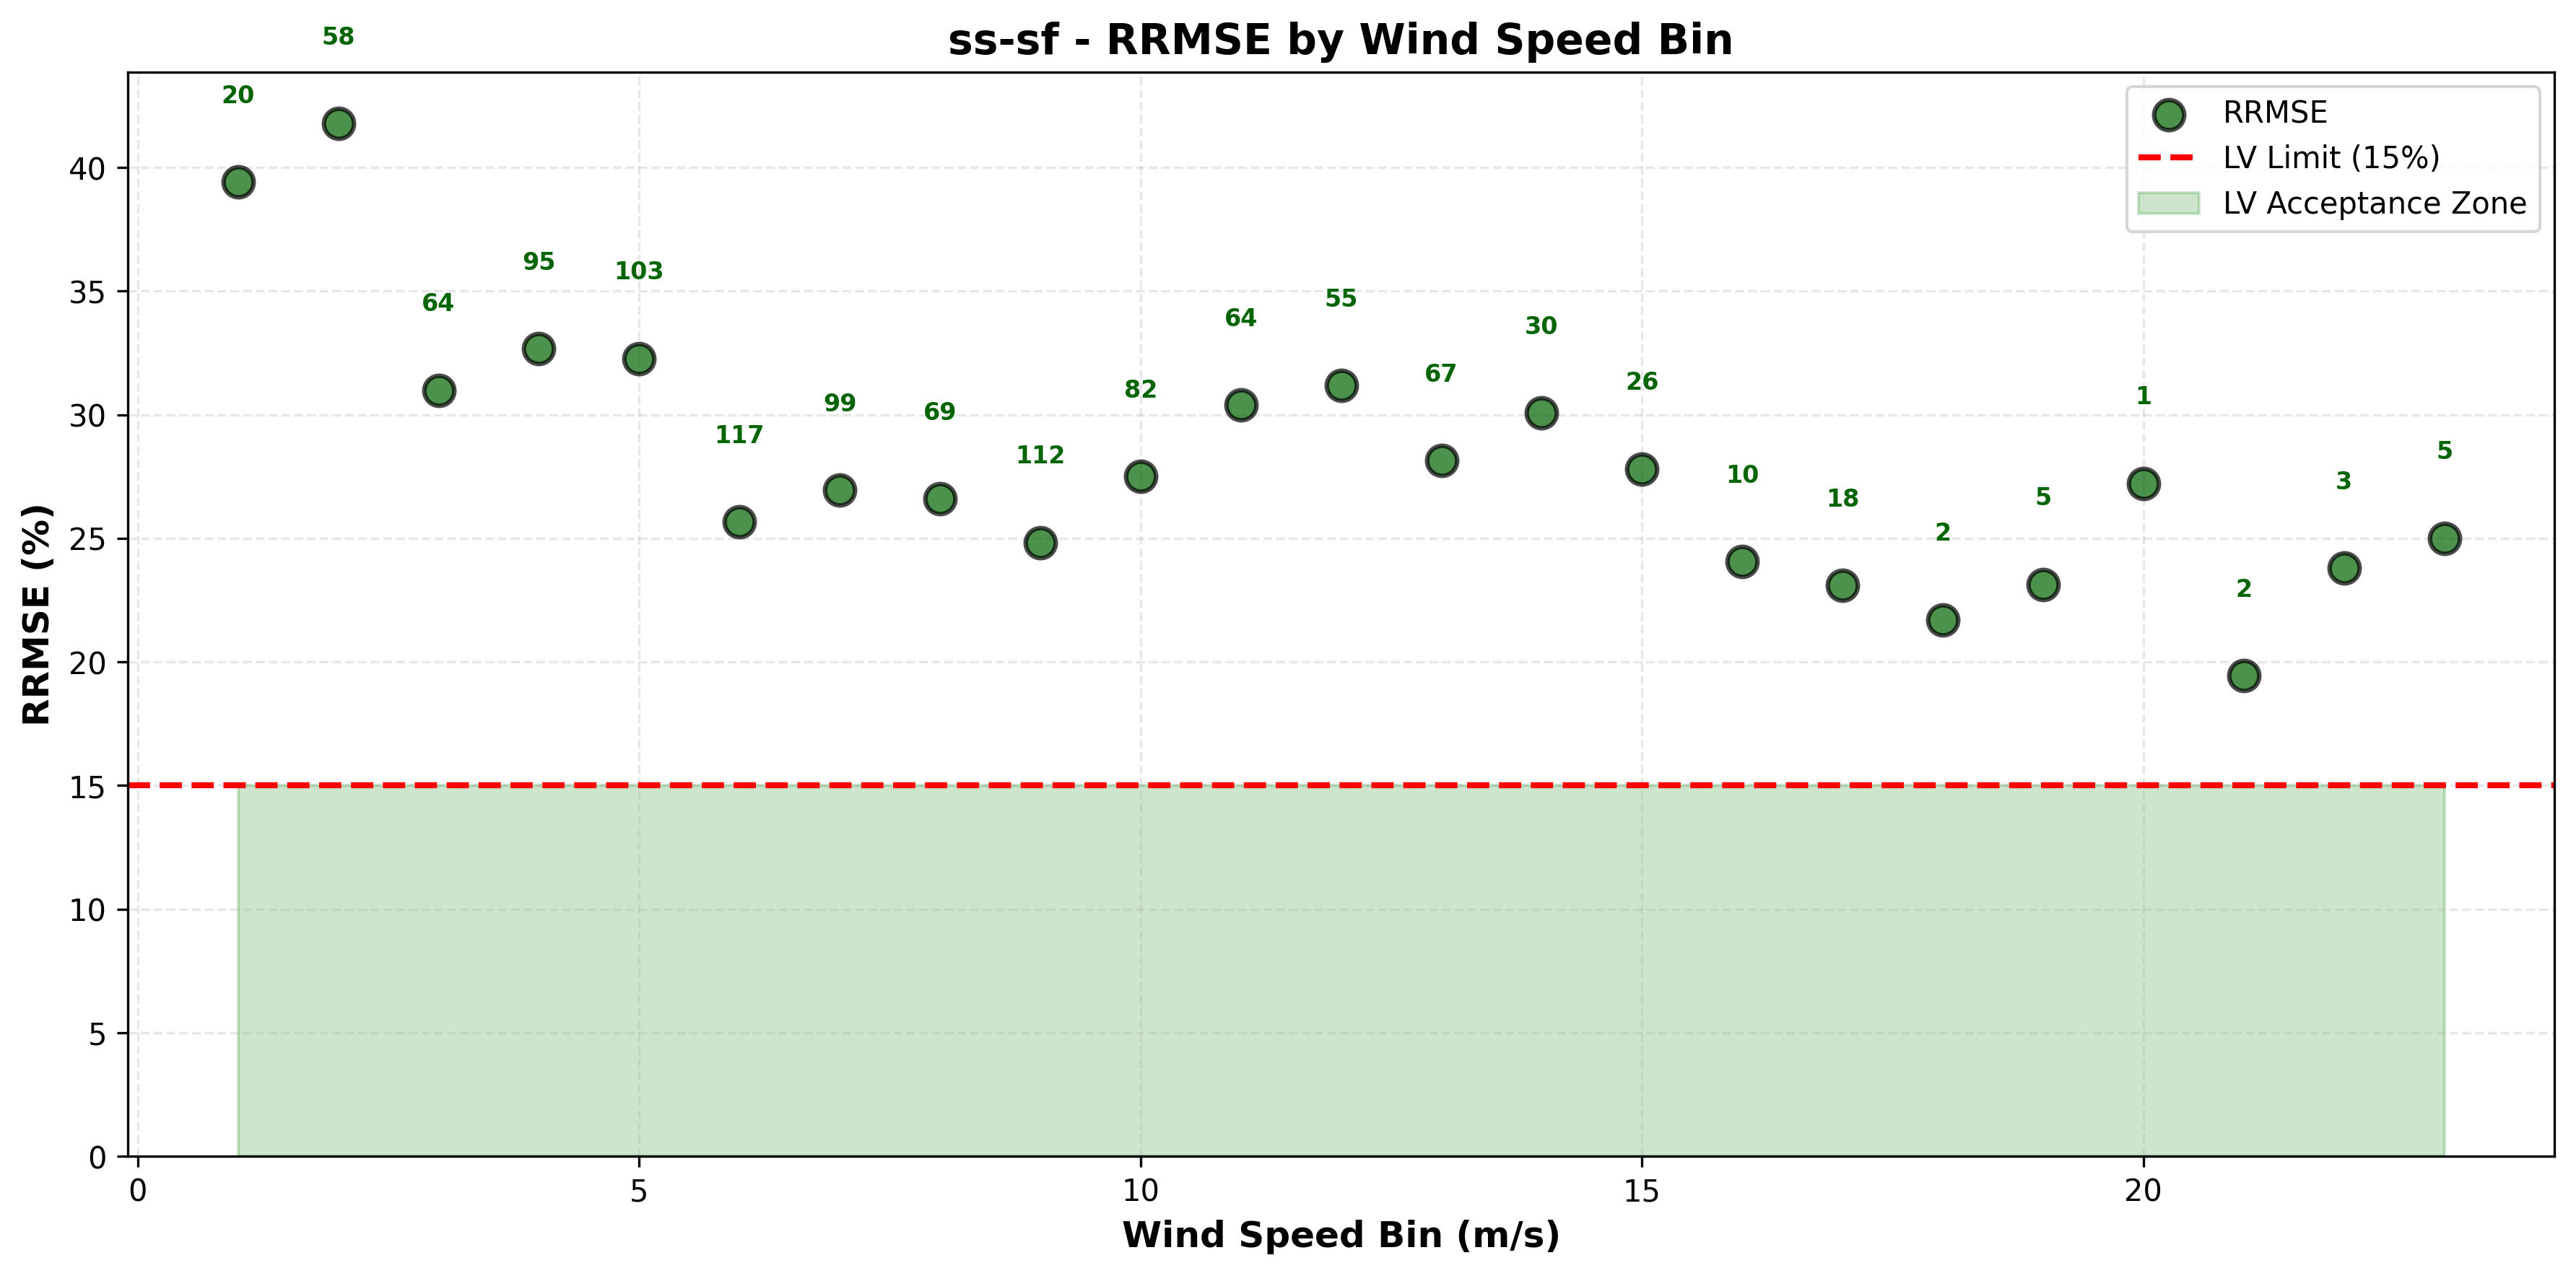
    **RRMSE** - Relative Root Mean Square Error measures overall accuracy

    Includes per-bin analysis and automatic pass/fail determination
  </Card>

  <Card title="Criteria Types" icon="list-check">
    **LV (Load Verification):** MRBE ≤ 5%, RRMSE ≤ 15% for turbine load calculations

    **PC (Power Curve):** Stricter criteria for power performance testing
  </Card>
</CardGroup>

## Visualization

Generate validation plots with a single function call.

```python theme={null}
from tact.visualization import plot_dnv_validation

plot_dnv_validation(
    validation_results=validation,
    adjusted_data=results["adjusted_data"],
    reference_col="ref_ti",
    adjusted_col="adjTI_RSD_TI",
    unadjusted_col="rsd_ti",
    wind_speed_col="ref_ws",
    bin_col="bins",
    method_name="SS-SF",
    output_dir="output/plots"
)
```

### Example Output

<div style={{display: 'grid', gridTemplateColumns: '1fr 1fr', gap: '20px', marginTop: '20px'}}>
  <div>
    <img src="https://mintcdn.com/akleaoinc/4HEL6Ey8zgZytw-m/images/ss-sf_mrbe_by_bin.png?fit=max&auto=format&n=4HEL6Ey8zgZytw-m&q=85&s=197859f8349d8120c2959a9adb9ec035" alt="MRBE by Wind Speed Bin" width="3568" height="1768" data-path="images/ss-sf_mrbe_by_bin.png" />

    <p style={{textAlign: 'center', fontSize: '0.9em', marginTop: '8px'}}>MRBE by wind speed bin with DNV acceptance limits</p>
  </div>

  <div>
    <img src="https://mintcdn.com/akleaoinc/4HEL6Ey8zgZytw-m/images/ss-sf_rrmse_by_bin.png?fit=max&auto=format&n=4HEL6Ey8zgZytw-m&q=85&s=b89fd7e2ec3fc3005a7060c79dacb29f" alt="RRMSE by Wind Speed Bin" width="3568" height="1768" data-path="images/ss-sf_rrmse_by_bin.png" />

    <p style={{textAlign: 'center', fontSize: '0.9em', marginTop: '8px'}}>RRMSE by wind speed bin with acceptance thresholds</p>
  </div>

  <div>
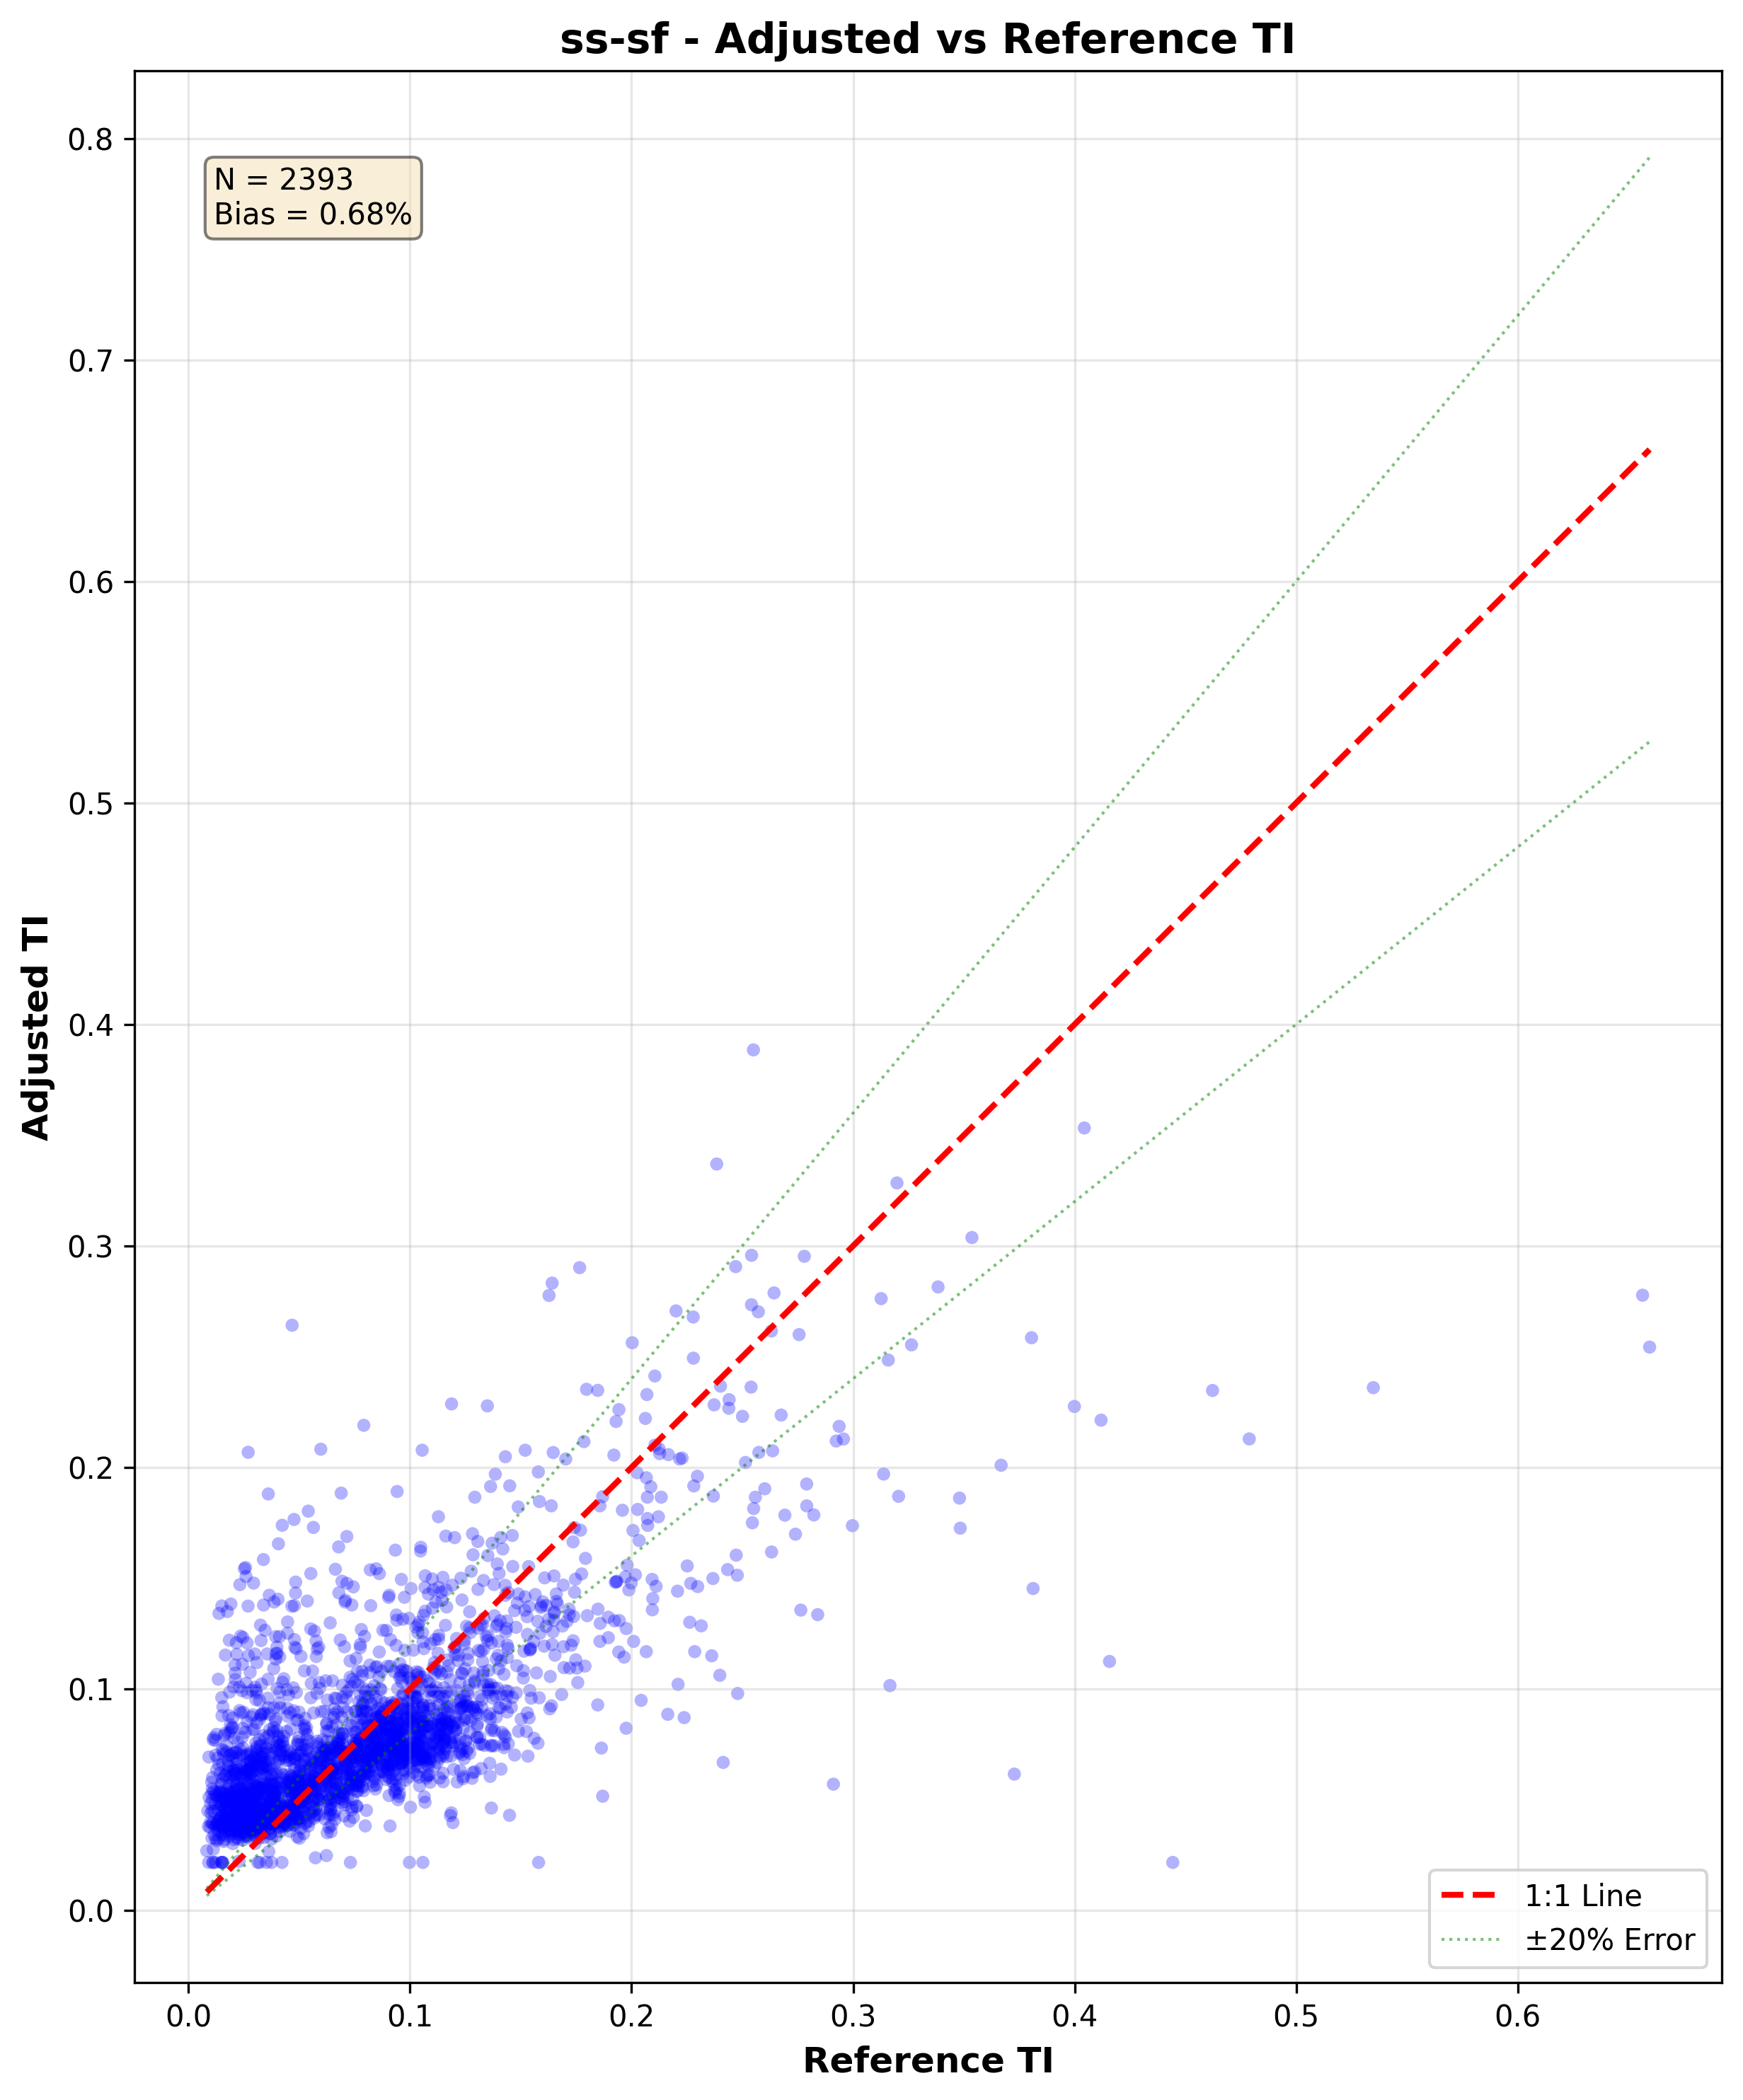
    <img src="https://mintcdn.com/akleaoinc/4HEL6Ey8zgZytw-m/images/ss-sf_ti_scatter.png?fit=max&auto=format&n=4HEL6Ey8zgZytw-m&q=85&s=6528ace82f5df07c1443fd055da030f1" alt="TI Scatter Plot" width="2463" height="2968" data-path="images/ss-sf_ti_scatter.png" />

    <p style={{textAlign: 'center', fontSize: '0.9em', marginTop: '8px'}}>Adjusted vs reference TI with 1:1 line and regression</p>
  </div>

  <div>
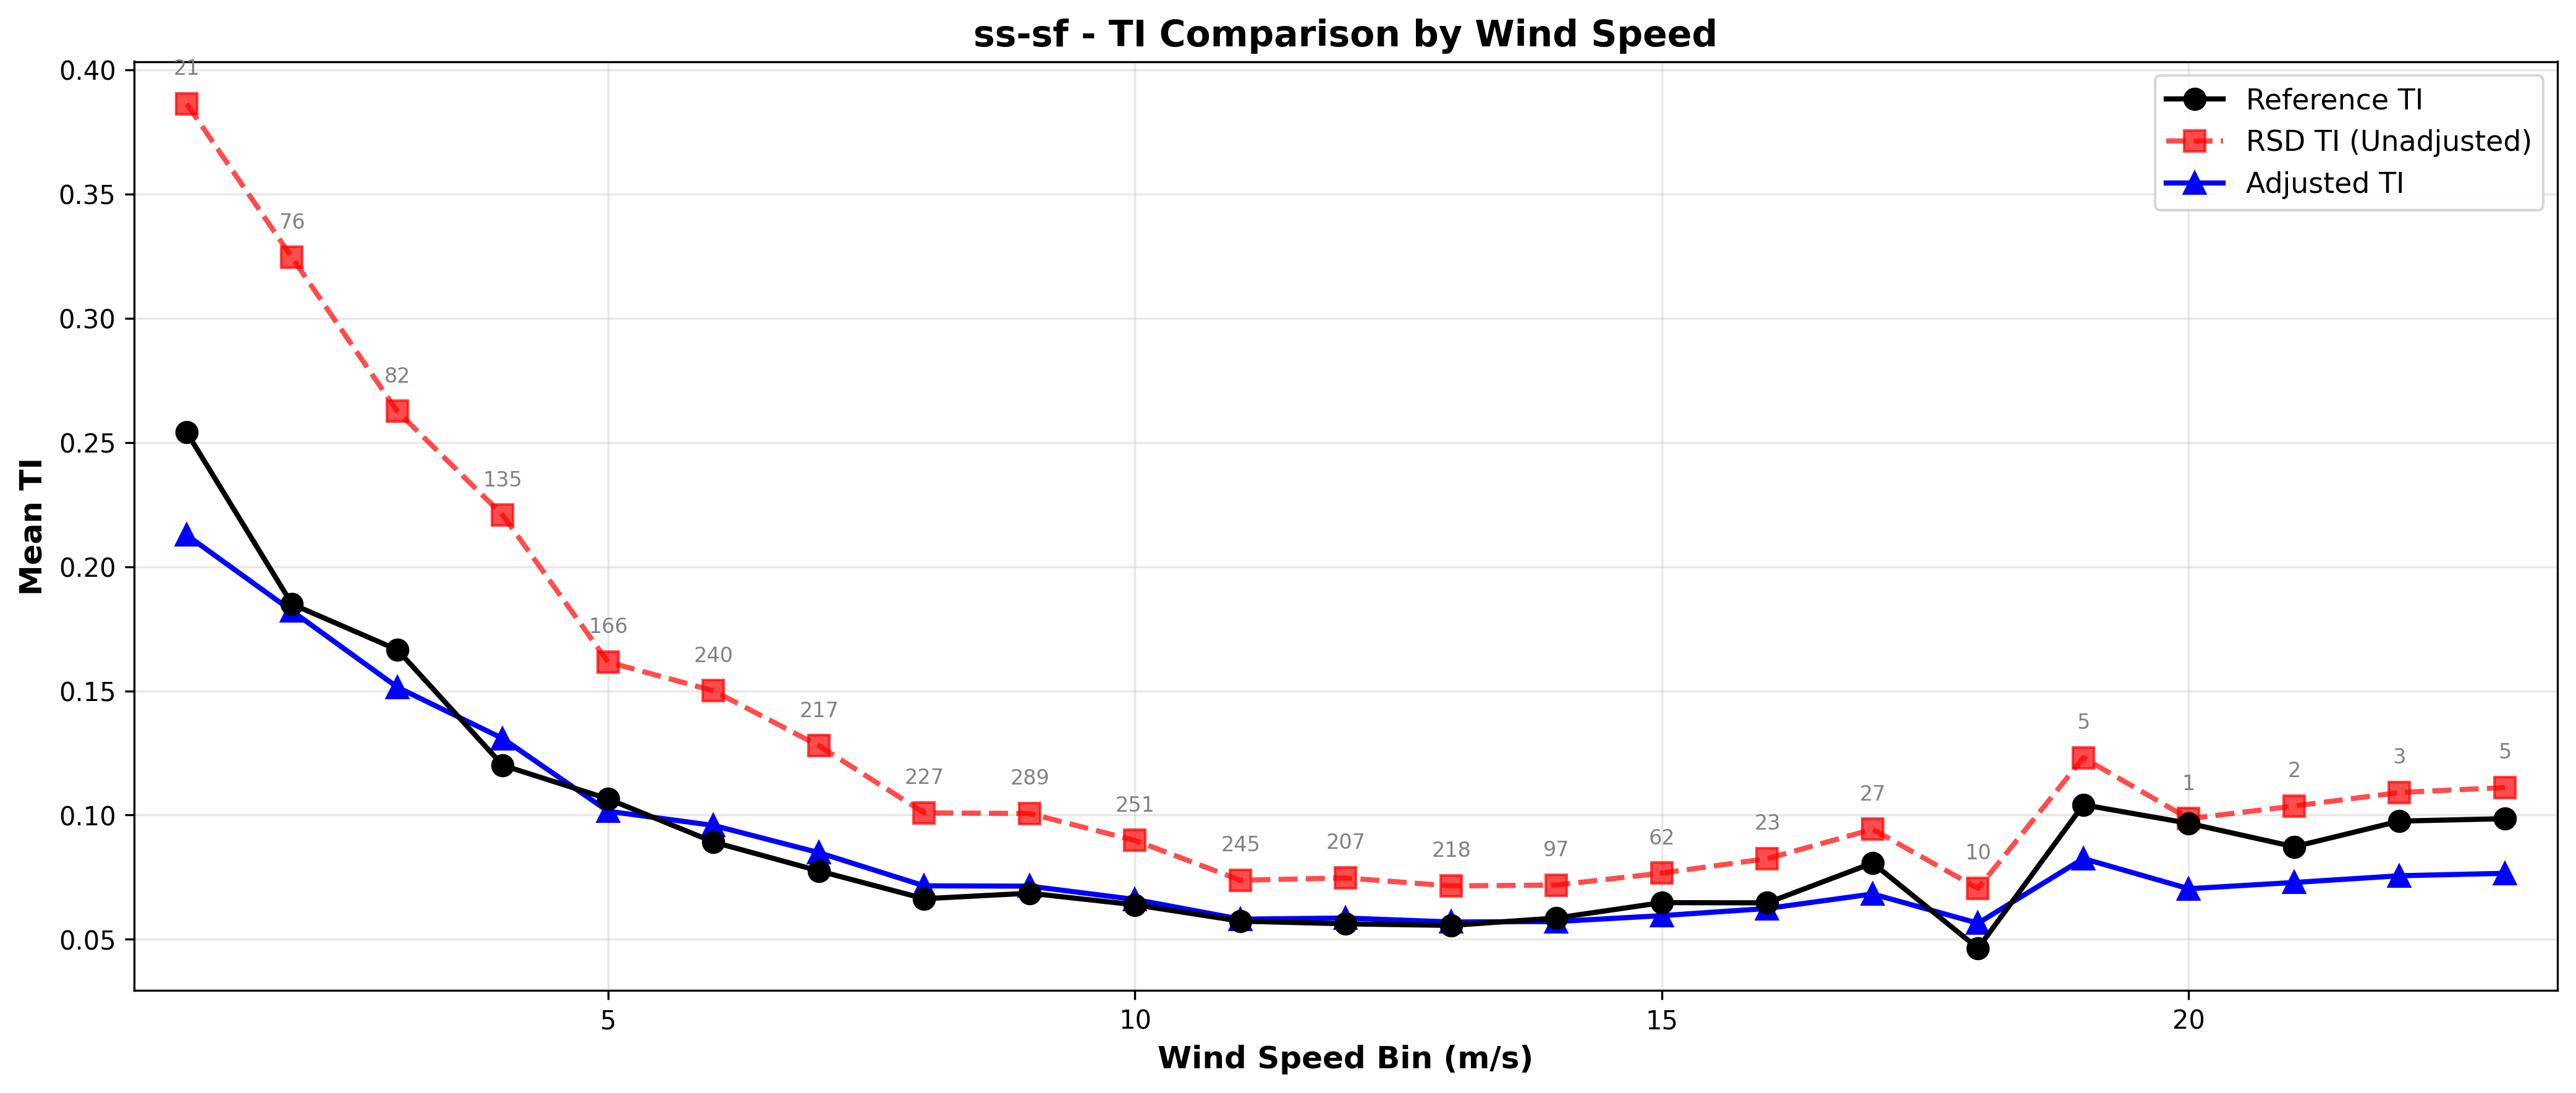
    <img src="https://mintcdn.com/akleaoinc/4HEL6Ey8zgZytw-m/images/ss-sf_ti_comparison.png?fit=max&auto=format&n=4HEL6Ey8zgZytw-m&q=85&s=83c2f5712230907246a92d24df52a4cb" alt="TI Comparison Plot" width="4168" height="1768" data-path="images/ss-sf_ti_comparison.png" />

    <p style={{textAlign: 'center', fontSize: '0.9em', marginTop: '8px'}}>Before/after adjustment comparison by wind speed bin</p>
  </div>
</div>

## Data Processing Pipeline

Standardized data processing ensures consistency and quality.

<Steps>
  <Step title="Data Loading">
    ```python theme={null}
    from tact.utils.load_data import load_data
    data = load_data("your_data.csv")
    ```

    * Automatic CSV parsing
    * Column validation
    * Missing data detection
  </Step>

  <Step title="Binning">
    ```python theme={null}
    from tact.utils.setup_processors import setup_processors
    bp, tp, sp = setup_processors("config.json")
    data = bp.process(data)
    ```

    * Configurable wind speed bins
    * Automatic bin assignment
    * Statistical aggregation
  </Step>

  <Step title="TI Calculation">
    ```python theme={null}
    data = tp.process(data)
    ```

    * Turbulence intensity computation
    * Representative TI calculation
    * Standard deviation handling
  </Step>

  <Step title="Statistical Analysis">
    ```python theme={null}
    data = sp.process(data)
    ```

    * Per-bin statistics
    * Correlation analysis
    * Quality metrics
  </Step>
</Steps>

## Extensible Architecture

Add your own adjustment methods with minimal code.

<CodeGroup>
  ```python Define Method theme={null}
  from tact.core.base import AdjustmentMethod
  from tact.core.registry import AdjustmentRegistry

  @AdjustmentRegistry.register("my-method")
  class MyMethod(AdjustmentMethod):
      def required_model_parameters(self):
          return {"config_path": str}

      def required_data_columns(self):
          return ["reference.wind_speed", "rsd.height_1.wind_speed"]

      def adjust(self, data, parameters):
          # Your adjustment logic here
          adjusted_data = data.copy()
          # ... implement your algorithm ...
          return {"adjusted_data": adjusted_data}
  ```

  ```python Use Custom Method theme={null}
  from tact import TACT

  tact = TACT()
  results = tact.adjust(
      data=data,
      method="my-method",
      parameters={"config_path": "config.json"}
  )
  ```
</CodeGroup>

<Note>
  See the [Adding Custom Models](add-custom-model) guide for a complete tutorial with examples.
</Note>

## Configuration System

Flexible JSON-based configuration for easy customization.

```json theme={null}
{
    "input_data_column_mapping": {
        "reference": {
            "wind_speed": "ref_ws",
            "wind_speed_std": "ref_sd",
            "turbulence_intensity": "ref_ti"
        },
        "rsd": {
            "primary": {
                "wind_speed": "rsd_ws",
                "wind_speed_std": "rsd_sd",
                "turbulence_intensity": "rsd_ti"
            }
        }
    },
    "binning_config": {
        "bin_size": 1.0,
        "bin_min": 4.0,
        "bin_max": 20.0
    }
}
```

Map your CSV columns to TACT's expected format (supports any column names), configure wind speed bins for analysis, and define method-specific parameters. See the [Configuration Guide](configuration) for detailed setup instructions.

## Python Package Features

<CardGroup cols={2}>
  <Card title="Importable Module" icon="cube">
    Use TACT in your own Python scripts from any directory

    ```python theme={null}
    from tact import TACT
    ```
  </Card>

  <Card title="Standalone Scripts" icon="terminal">
    Run included example scripts directly

    ```bash theme={null}
    python main.py
    python compare_all_methods.py
    ```
  </Card>

  <Card title="Jupyter Compatible" icon="book">
    Works seamlessly in Jupyter notebooks for interactive analysis
  </Card>

  <Card title="Minimal Dependencies" icon="box">
    Only requires standard scientific Python packages (numpy, pandas, matplotlib)
  </Card>
</CardGroup>

## Next Steps

<CardGroup cols={3}>
  <Card title="Getting Started" icon="rocket" href="getting-started">
    Run your first adjustment
  </Card>

  <Card title="Compare Methods" icon="code-compare" href="quickstart">
    Evaluate all adjustment methods
  </Card>

  <Card title="Add Custom Method" icon="plus" href="add-custom-model">
    Extend TACT for your needs
  </Card>
</CardGroup>