Prerequisites
System Requirements
System Requirements
- Python 3.8 or higher
- pip (Python package manager)
- Git (for cloning repository)
- Virtual environment tool (recommended)
What You'll Need
What You'll Need
- CSV file with reference and RSD measurements
- At least 500+ paired observations (2000+ recommended)
- Wind speed, standard deviation, and TI columns
- Data across 4-20 m/s wind speed range
Installation
Quick Start with Example Data
The fastest way to see TACT in action is to run the included example:- Adjusted turbulence intensity dataset
- DNV RP-0661 validation results
- Visualization plots
- Statistical summaries
Basic Workflow
Here’s the core workflow for adjusting your own data:Using Your Own Data
Prepare Your Data
Ensure your CSV includes reference and RSD measurements with wind speed, standard deviation, and turbulence intensity columns.Need detailed data requirements? See the Data Import Guide for column formats, units, and quality requirements.
Create Configuration File
Map your CSV column names to TACT’s expected format:Need help with configuration? See the Configuration Guide for detailed setup instructions.
Run Adjustment
Use the workflow code above with your data and config file paths.Want step-by-step instructions? See Running Adjustments for complete workflow details.
Validate Results
Check your results against DNV RP-0661 standards and generate validation plots.Learn about validation: See the DNV Validation Guide for criteria types, interpretation, and troubleshooting.
Visualization
Generate validation plots to visualize adjustment performance:- MRBE by wind speed bin - Systematic bias across wind speeds with DNV acceptance limits
- RRMSE by wind speed bin - Measurement scatter with acceptance thresholds
- Scatter plot - Adjusted vs reference TI with 1:1 line and regression fit
- Comparison plot - Before/after adjustment by wind speed bin
Example Plots
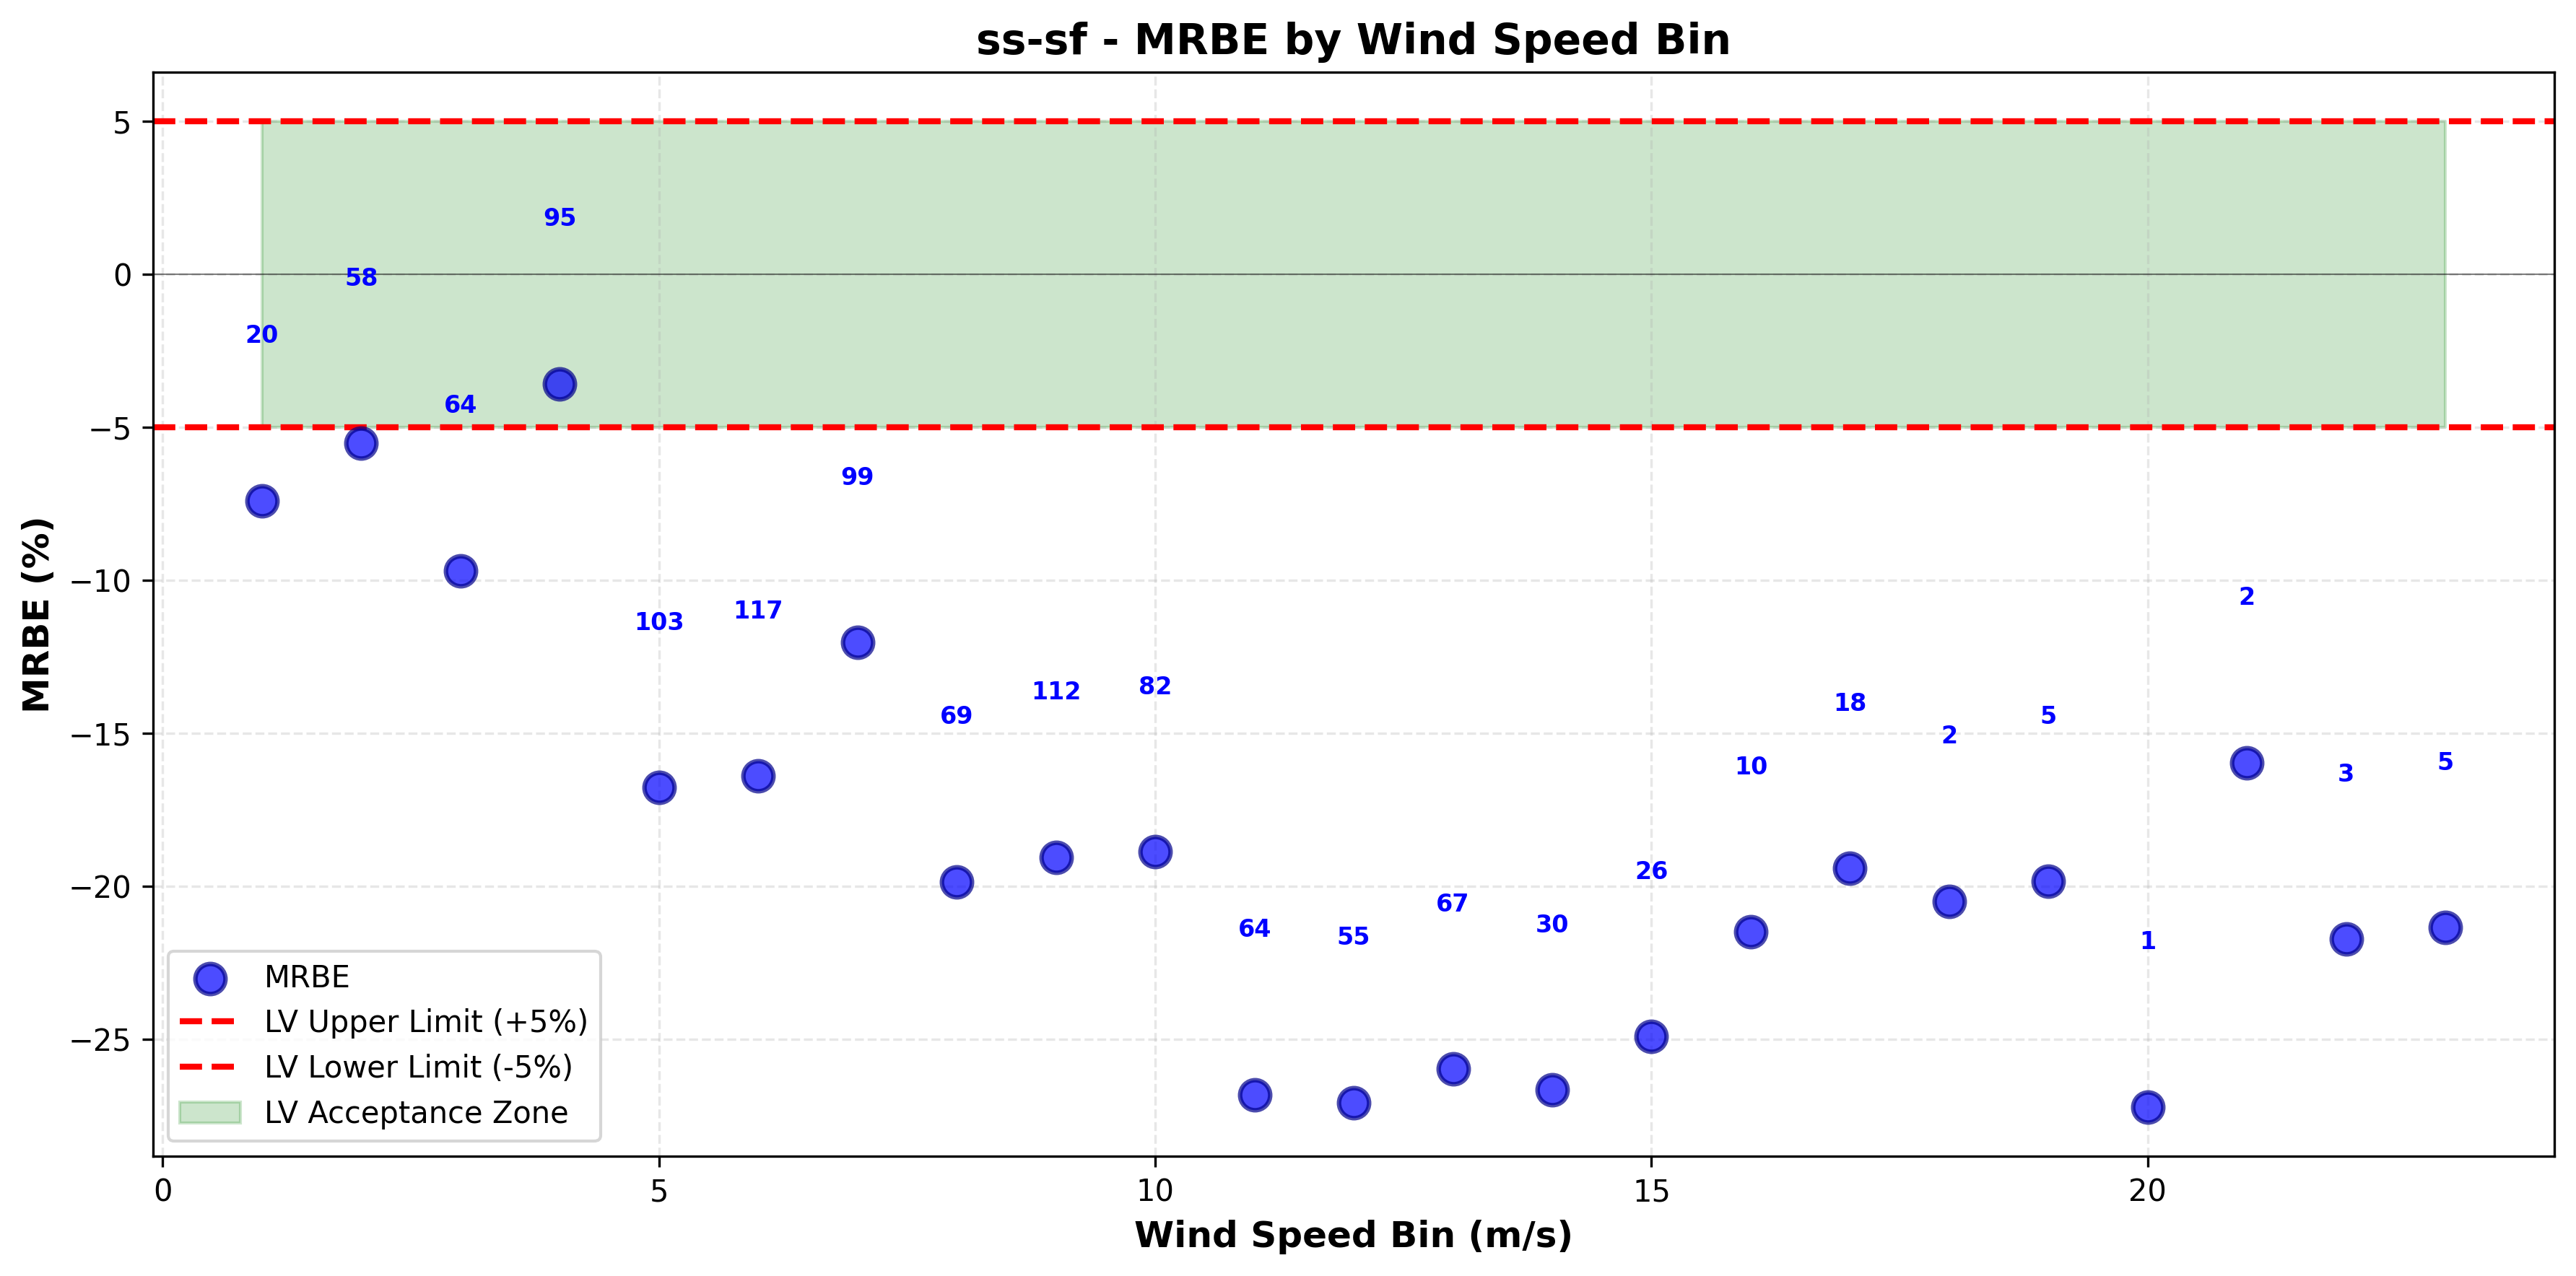
MRBE by wind speed bin
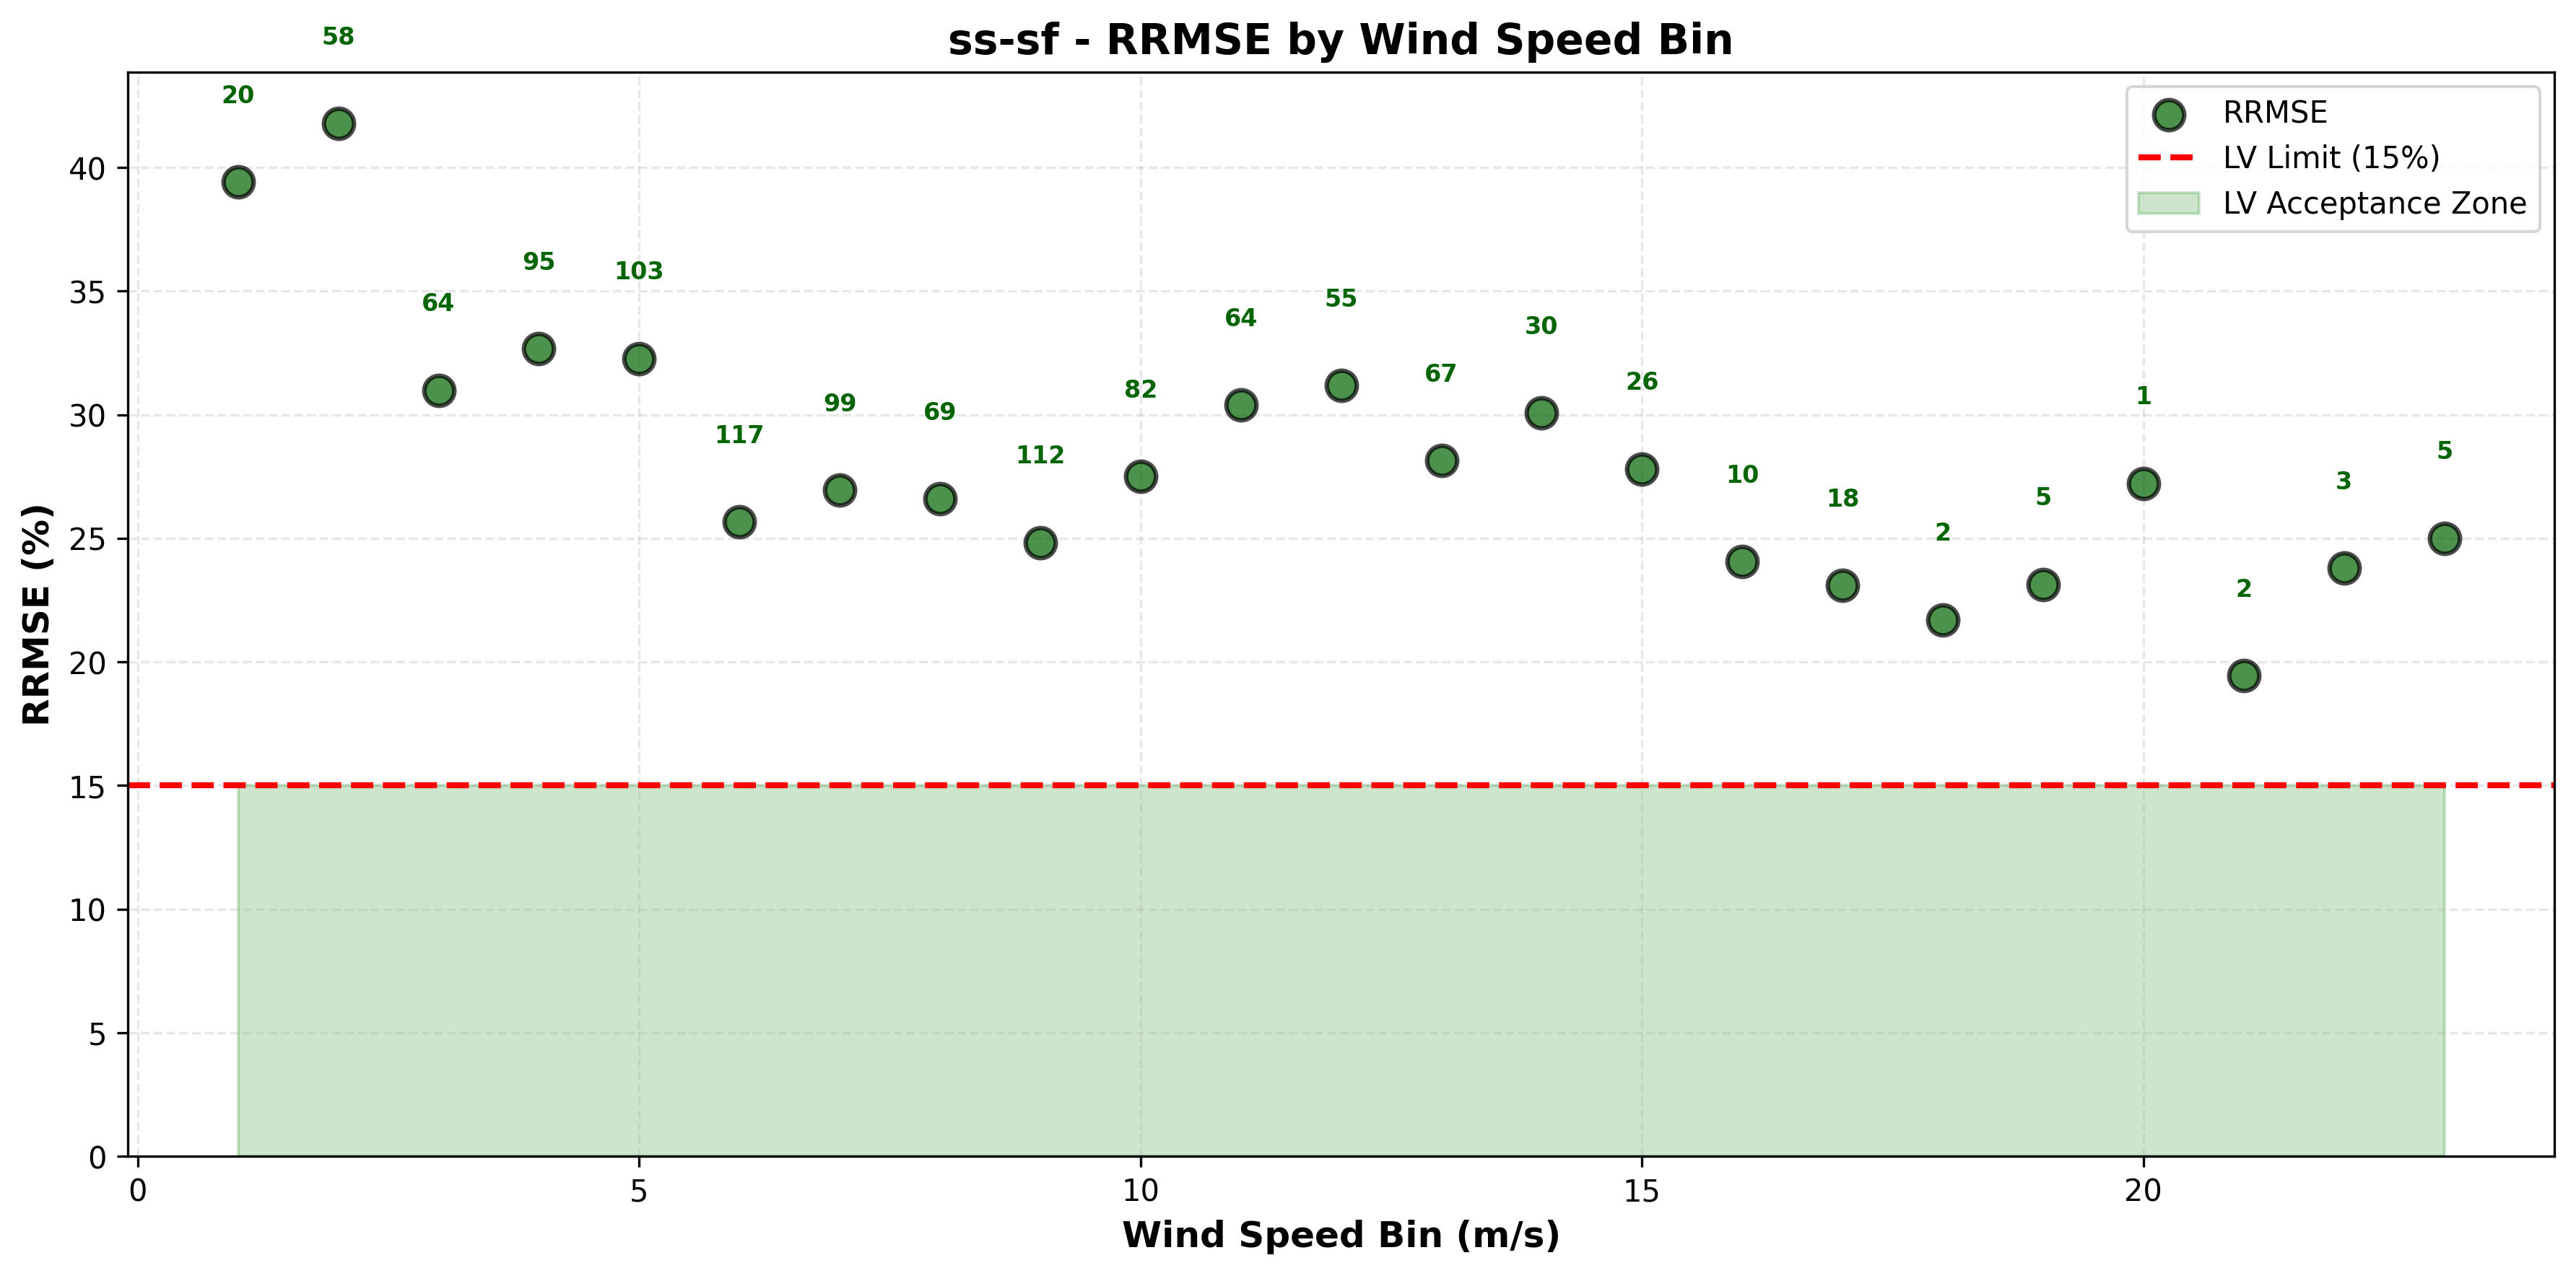
RRMSE by wind speed bin
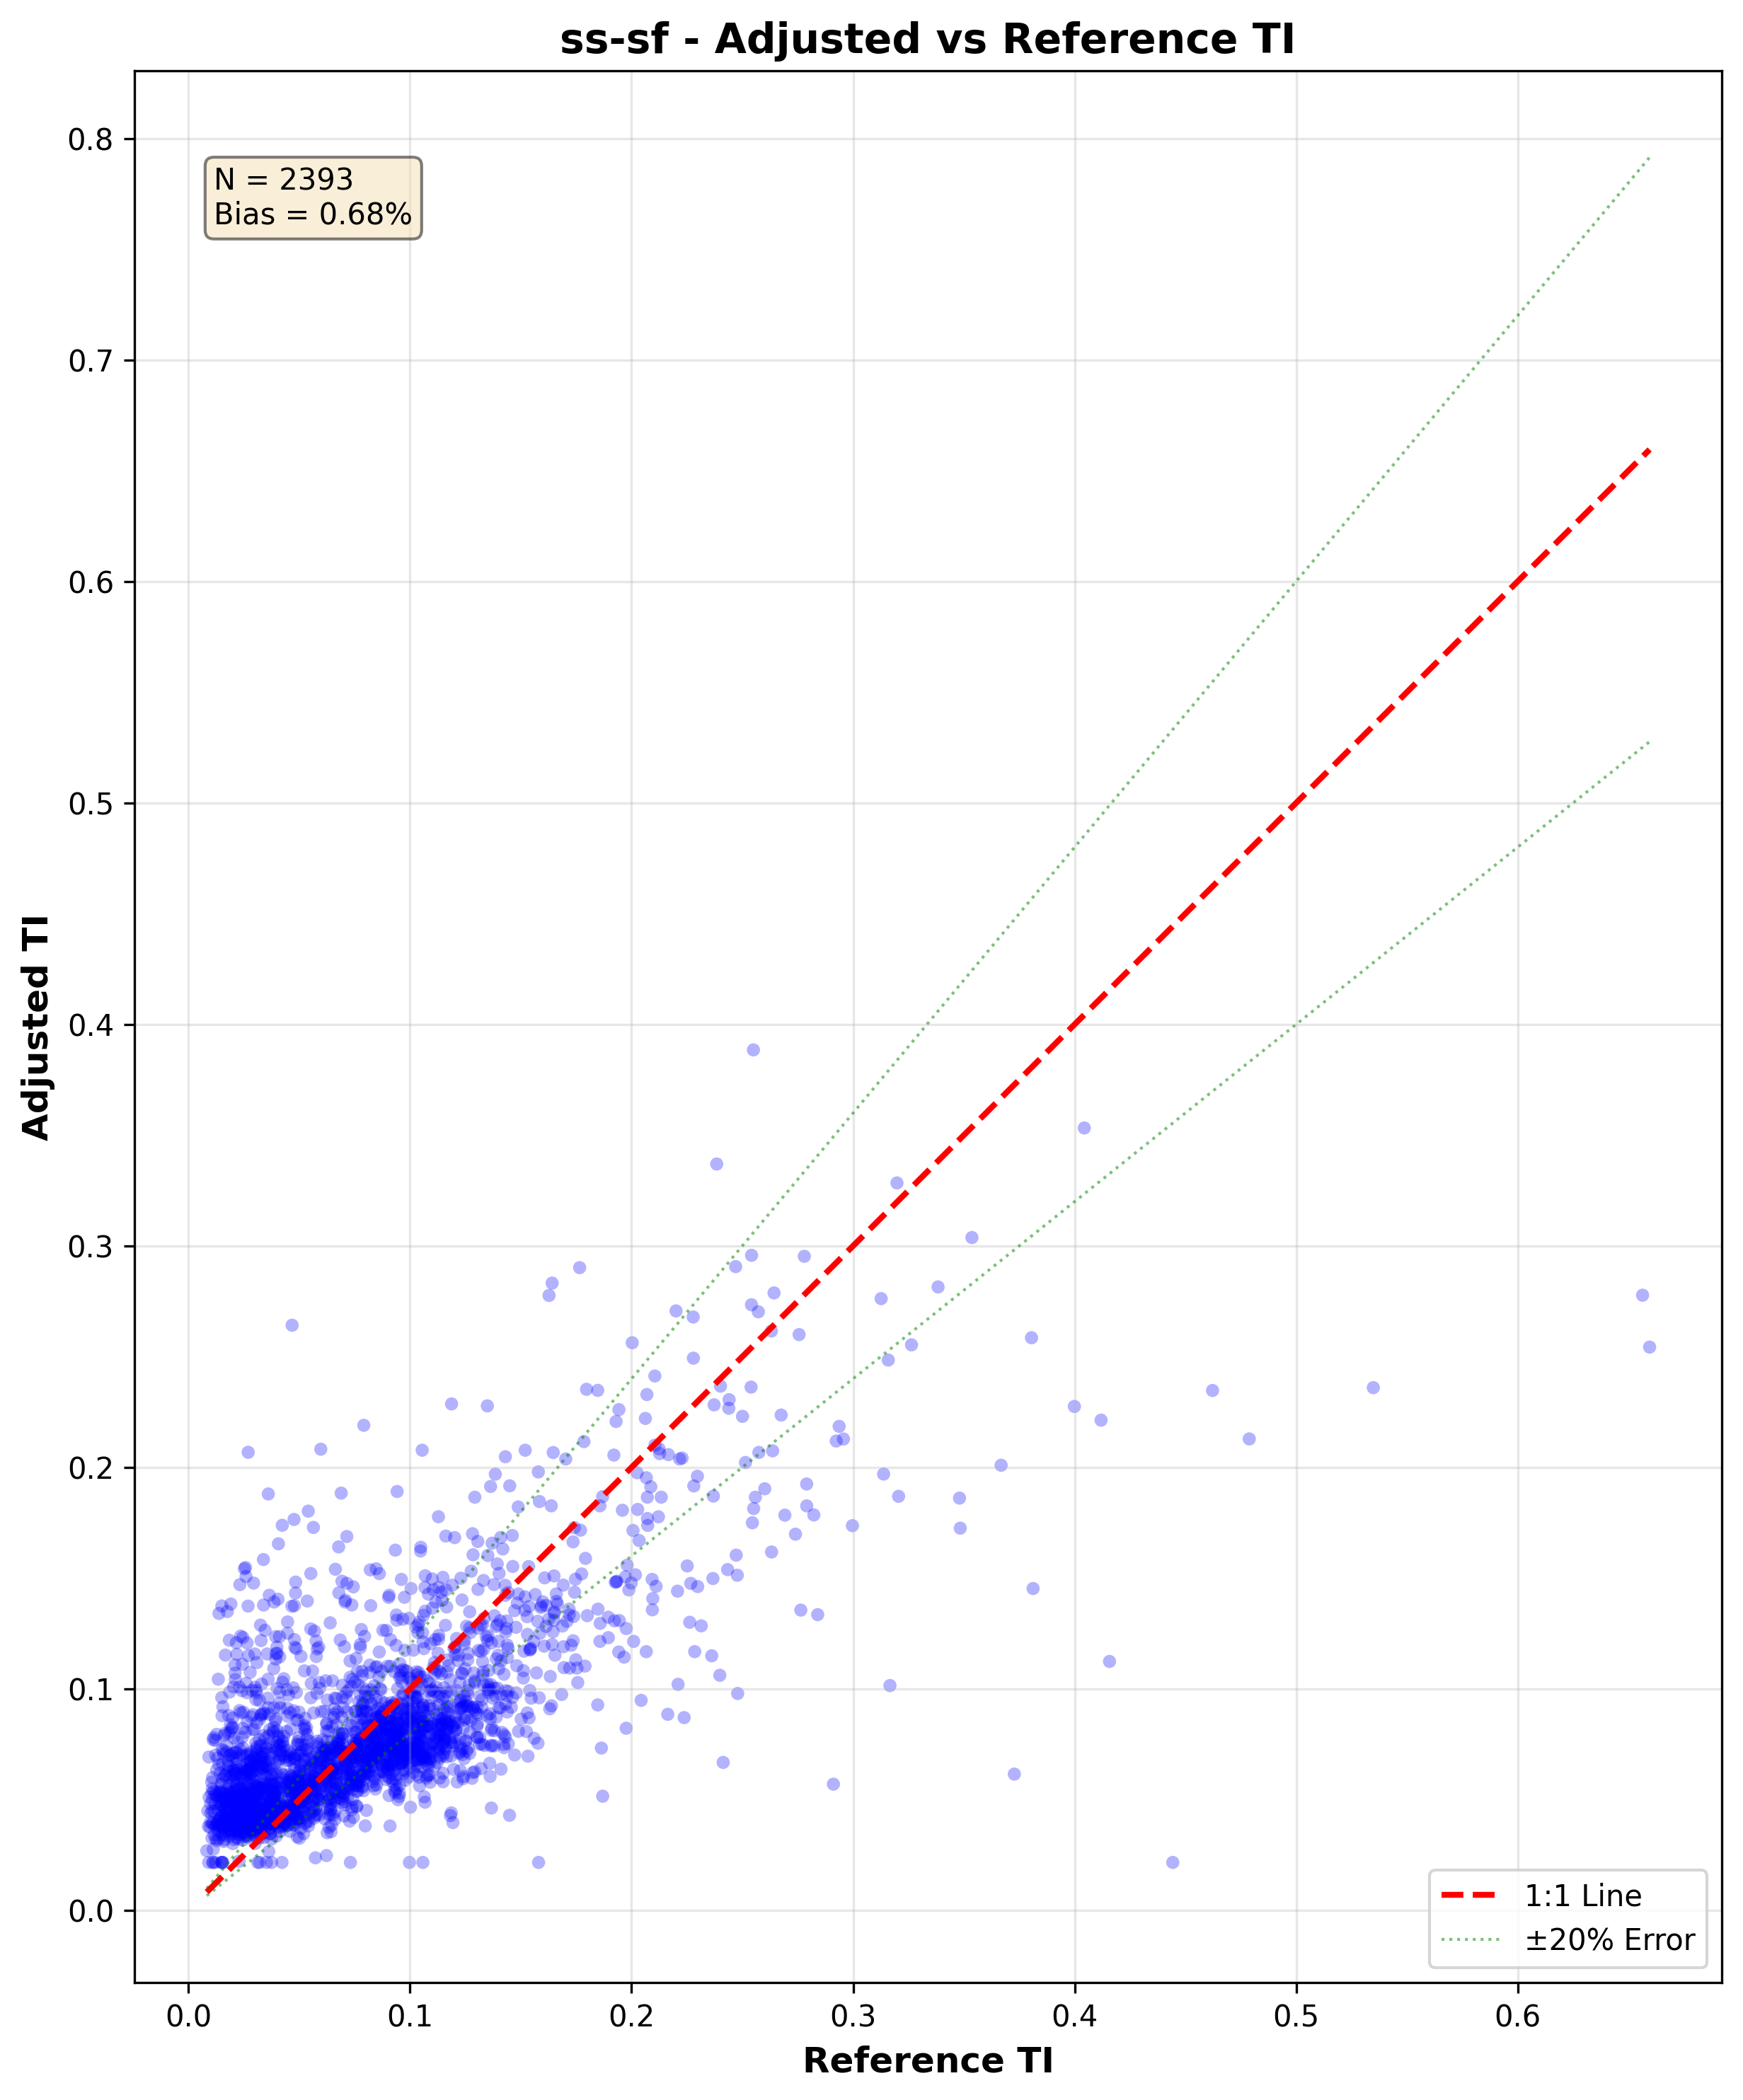
Adjusted vs reference TI scatter
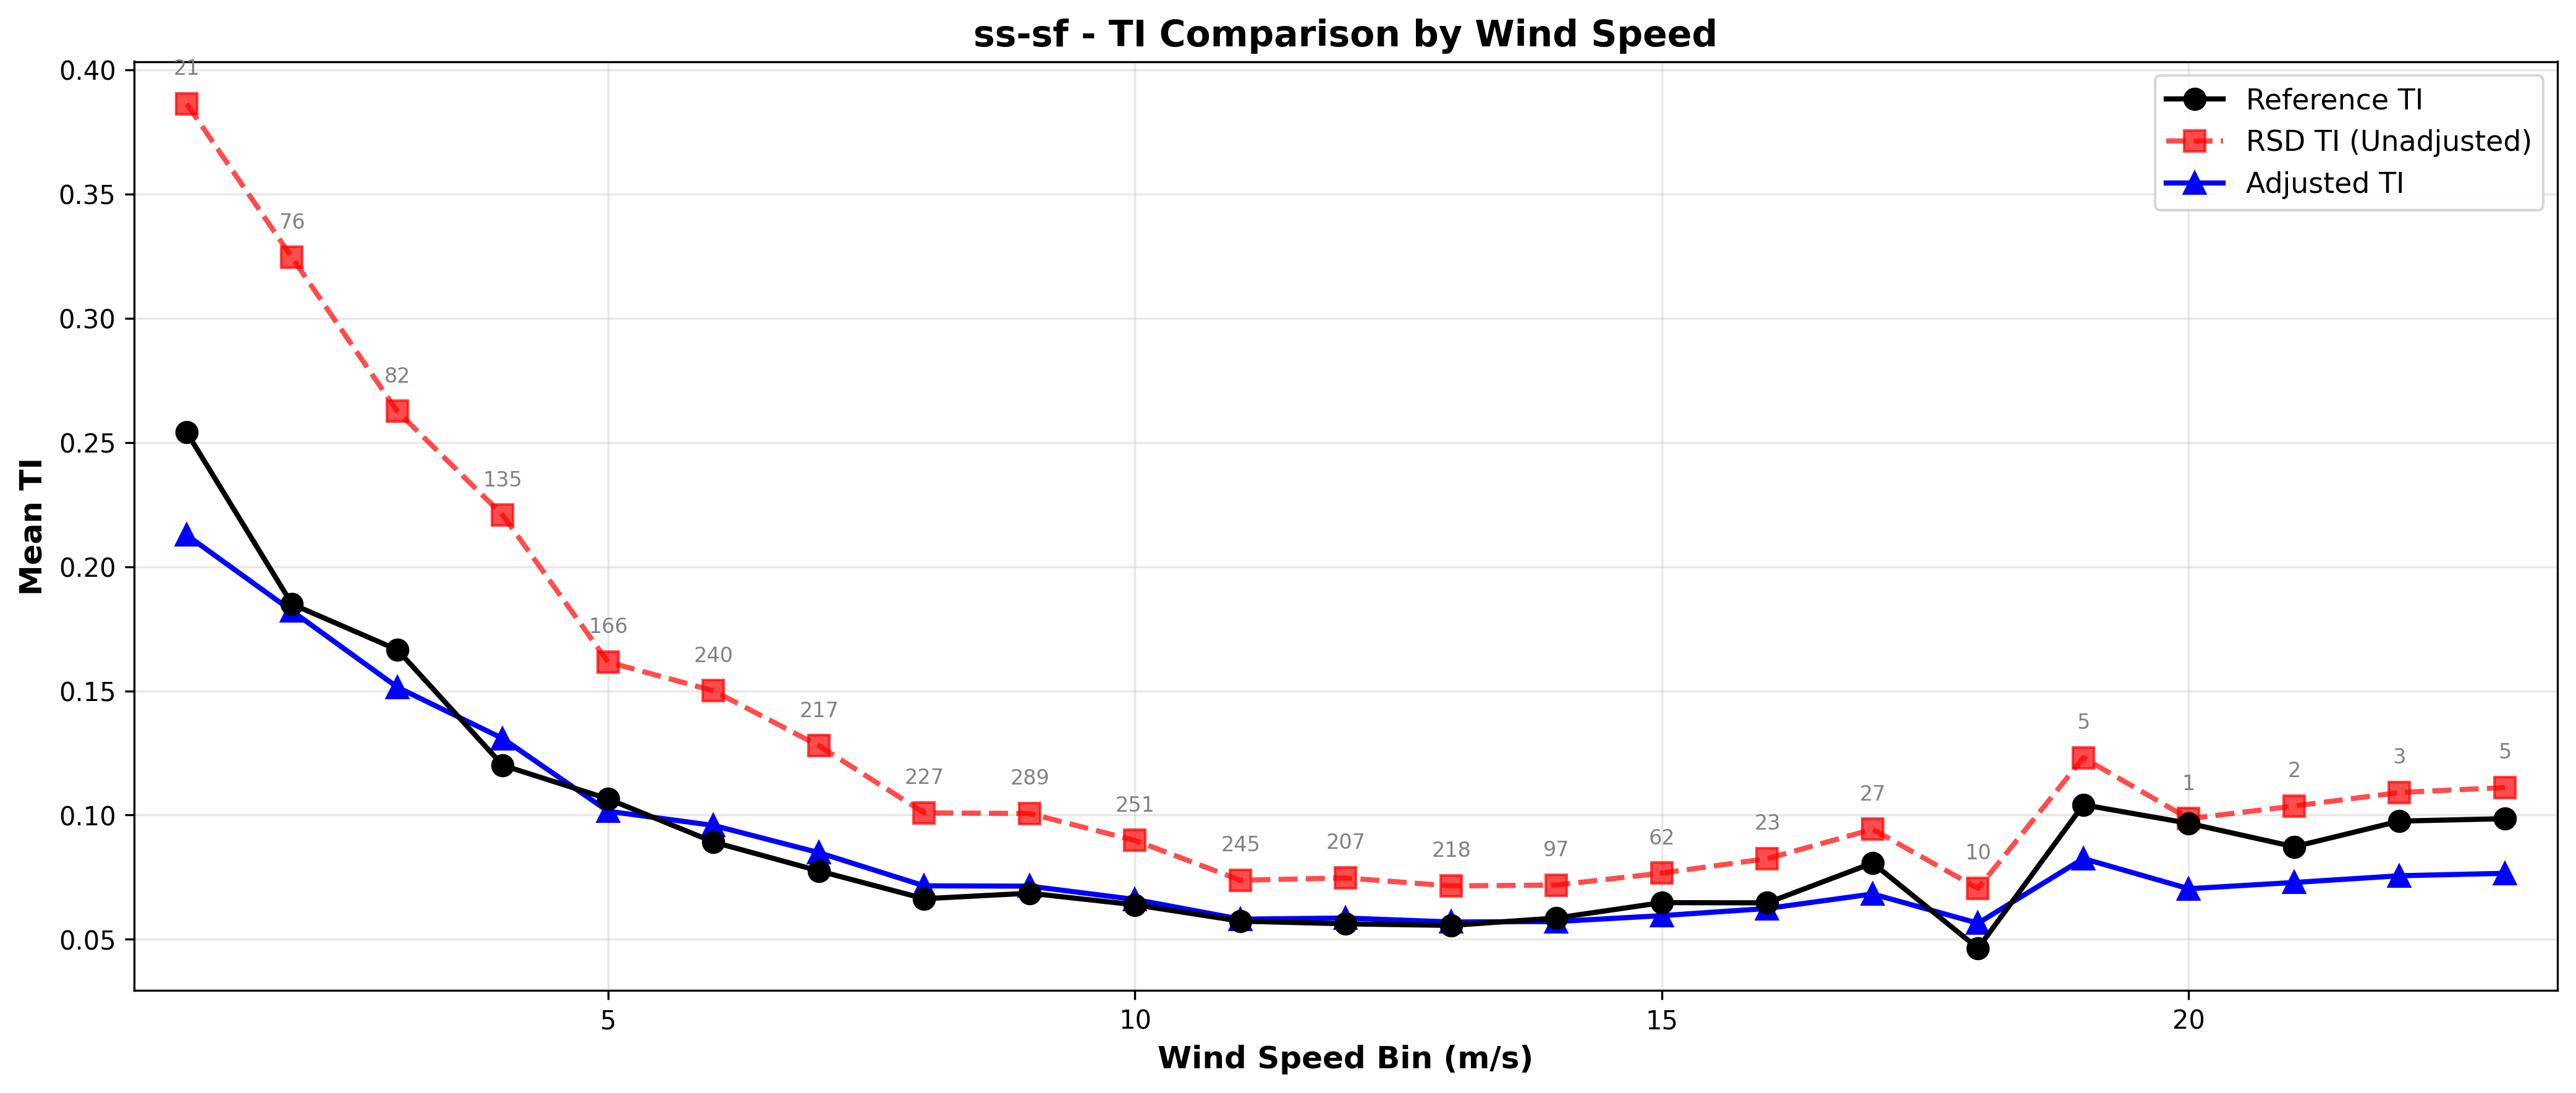
Before/after adjustment comparison
Available Adjustment Methods
SS-SF
Site-Specific Simple + Filter. Direct TI regression with filtering.
SSWSStd
Site-Specific Wind Speed + Standard Deviation. Dual adjustment approach.
SSWS
Site-Specific Wind Speed. Adjusts wind speed only.
Baseline
No adjustment. Useful for benchmarking and comparison.
Custom Method
Add your own adjustment algorithm using TACT’s extensible framework.
Performance varies by dataset. Compare all methods on your data using
compare_all_methods.py to find the best fit.Next Steps
Configure Your Data
Set up column mappings and binning
Run Adjustments
Detailed workflow and parameters
Validate Results
DNV RP-0661 validation
Import Data
Data format and requirements
Troubleshooting
Fix common issues
Add Custom Methods
Extend TACT for your needs
Common Issues
ModuleNotFoundError: No module named 'tact'
ModuleNotFoundError: No module named 'tact'
Solution: Activate your virtual environment
KeyError: Column not found
KeyError: Column not found
Solution: Check your config file column mappings match your CSV column namesThen update
config.json to match.Poor validation results (high MRBE/RRMSE)
Poor validation results (high MRBE/RRMSE)
Common causes:
- Data not time-synchronized between RSD and reference
- Missing quality filtering
- RSD too far from reference (more than 200m)
- Sensor calibration issues
Quick Reference
Run example:- Data:
tact/example/data/tact-test-data.csv - Config:
tact/example/config.json
ss-sf
DNV acceptance criteria (LV): MRBE ≤ 5%, RRMSE ≤ 15%
Need help? Check the Troubleshooting Guide or contact support at aea@nrgsystems.com